What Makes People Stick to Food Diary
精选项目展示 | Links:

A quick summary:
Encouraging client to keep tracking a food diary is an important pilar of a weight management program; and fitness personal trainers should anticipate the risk of a client to quit food diary and take actions accordingly.
However, this is achieved through subjective judgement and personal experience. Normally personal trainer will provide bunch of standard suggestions to the client, but we don’t know which one works.
Here I trained a model to predict whether a client will stick to food diary for a long time based on one week of his or her food log and explored the impact of different factors impacting the result.
Based on the analysis, I summarized the importance of those different factors and recommended three key area to focus on: setting proper Protein target, setting proper Sugar target, and ensuring enough Calorie’s intake comparing to the Calories target.
I. Background and Objectives
Weight management is a popular topic in the fitness industry. There are different approaches to address this trending concern. The most common and most popular one is to keep a food diary. On one hand, it helps setting up the baseline of daily consumption and monitoring the progress against certain diary plans. On the other hand, it helps people realizing the benefit of change the lifestyle.
As an experienced ACE fitness personal trainer, I always suggest people who are interested in weight management program to keep tracking a food diary. Being able to track food diary on a regular base not only helps clients to reach their weight goal, but also facilitates the change of lifestyle - which should be considered as an issue of change management rather than of fitness.
Based on the experience, a personal trainer could somehow develop a hypothesis whether a client will stick to food diary for a long time through interview and first few training sessions. But this process is very subjective. From a data scientist’s point of view, I’m interested in exploring the insight of client’s food log history applying machine learning techniques.
The objective is to provide a new way of early identification of high churn risk clients, and to provide tailored recommendation to them. To be more specific, the questions I’d like to answer as both data scientist and fitness trainer are:
Knowing one week’s food log, how can we predict whether a client will keep food diary for more than 2 months? What actions can be taken to impact client at the early stage?
II. Exploratory Data Analysis
The dataset contains the food diary of ~9.9K users of MyFitnessPal. The observation started from September 2014 through April 2015 (https://www.kaggle.com/zvikinozadze/myfitnesspal-dataset). The original dataset has more than 500k rows. Each row represents one day of food diary of one user, including a summary of the daily target and daily intake. The daily summary of each user contains multiple metrics. Based on my experience, here I include only the most common ones: Calories, Carbs, Fat, Protein, and Sugar. The rest, such as Fiber, Sodium, will not be included for now, as those are normally not monitored in a diet plan for majority of people.
Here I will not enter into details about the data cleaning. Only few steps I’d like to highlight:
- Within almost 7 months of data, 15% of users log their food and beverage for less than 7 days. I dropped those users since I want to use the food diary of the first week to make prediction.
- The exact date of each food log doesn’t add much value. Rather we care more about the sequence of the date. For each user, we transfer the exact date to day 0, day 1, day 2 and so on, by subtracting the first date of food log during the observation period.
- MyFitnessPal tracks lots of different metrics. Since here the analysis is focusing on weight management, I only keep the target and daily consumption of Calories, Carbs, Fat, Protein, and Sugar in my analysis.
- The original dataset is stored with a quite messy structure. There are only four field - ID, Date, Food_Log, and Daily_Sum. Food_Log and Daily_Sum are two json structure storing the details of food dairy and daily summary. After data cleaning and transformation, I created a new dataset including only the fields we are interested in.
- Considering the possible novelty effect, for each user, instead of using the food log from day 0 to day 6, I use the one from day 3 to day 9. This is a design choice - I also tried the period between day 2 to day 8 and day 4 to day 10, the result doesn’t change much.
Also, a new dataframe is created - each row represents a user. More features will be introduced to this dataframe, and I will train the model based on it.
III. Feature Engineering
For each of Calories, Carbs, Fat, Protein, and Sugar, based on my knowledge and expertise as fitness trainer, I create the new features:
- Mean and standard deviation of 7 day’s daily target
- Mean and standard deviation of 7 days’ actual daily intake
- Mean and standard deviation of ratio between actual intake and target
- Percentage of calories coming from Carbs/Fat/Protein/Sugar, for both target and actual intake. Calculate the mean and standard deviation
- Number of days with food diary within the 7 days’ period
- Whether the user keeps food diary for more than 2 months
Not surprisingly, there are missing values in the features. Here I keep them in dataset and set to -1, as missing value itself might be a good feature for prediction. For example, missing Protein target probably suggests that the user didn’t set it up. This potentially could impact whether he or she will stick to food diary for a long time.
Luckily, I have a balanced dataset - within the ~8300 users, ~4300 users keep food diary for more than 2 months.
III. Modeling
I trained a Light GBM model on the dataset, using the library Hyperopt to implement auto hyperparameters tuning.
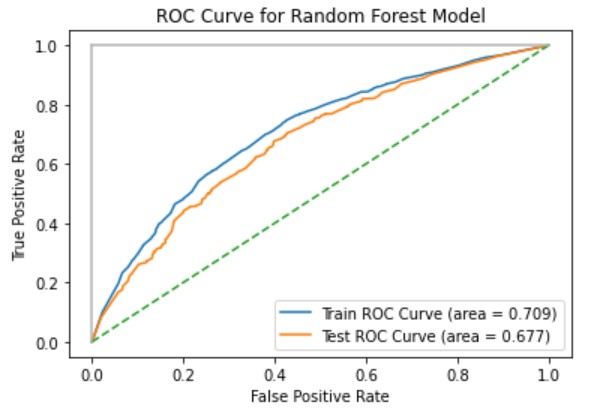
The figure below shows ROC curve of the trained model on training set and test set. Here I choose 0.5 as cut-off threshold, as the data is almost balanced. The AUC score on training set is 0.71 while the AUC score on test set is 0.68. The risk of overfitting is low in this case.
IV. Discussion
I will explore the impact of different features using four different ways:
- The feature importance bar chart
- Light GBM tree plot
- SHAP - feature importance
- SHAP - partial importance plot
Feature Importance
The figure below shows the feature importance.
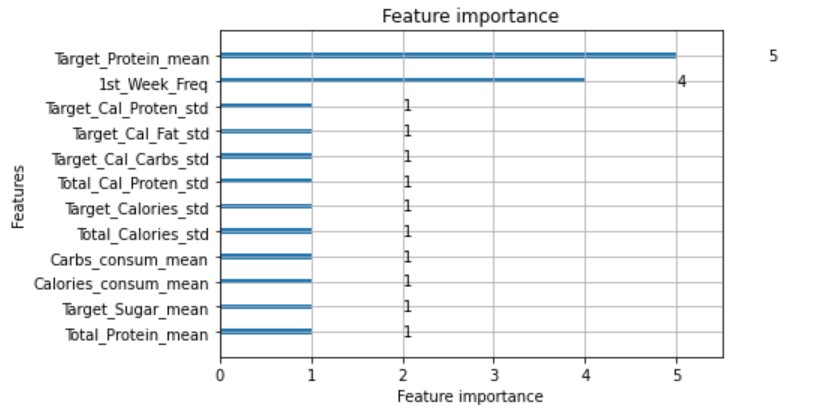
Surprisingly, the most important feature is the average of actual Protein intake of the 7 days. Further investigation is needed to explain the reason behind.
Number of days with food diary within the first week is the second most important feature. This is indeed what we should expect. If a user could not even keep the food log for 7 days, it is less likely that they will make it for more than 2 months.
Light GBM Tree Plot
To further understand the impact of different features, here I will display the top layers of the tree plot of the trained Light GBM model. It might not provide us the information precisely, as Light GBM is not training a single tree. However, at high level, such tree plot could provide good indications about the important features and how do they impact the prediction.

By showing how does the tree break at the first few nodes, we could observe that:
- Maintain a certain level of Protein intake helps user to stick to the food diary. The logic behind might be complicated. In my experience, people who are more into fitness and have certain level of knowledge about diet and nutrition tend to pay more attention to their Protein intake. It is possible that the Protein intake here actually works as the proxy to identify whether a client have well-structured and carefully planned diet plan.
- Whether monitor Carbs and Protein also have strong impact. Not monitoring Carbs or Protein indicates unmature understanding of how food diary works. Eventually such lack of understanding will hurt the motivation of client to keep food log.
- Set the Sugar target low will help to keep food log. On one hand, Sugar target might work as a proxy in identifying users who have more experience with weight management. On the other hand, decent control of Sugar helps the client to reach their target of the weight management program, providing positive incentive to stick to food log.
SHAP - Feature Importance
SHAP is a fascinating library to explore the impact of features. The only issue of SHAP is that it requires certain knowledge in machine learning to understand. The plot might not be good to present to C-suite client. But it is good to share within the team of data scientists.
The figures below the SHAP feature importance plot on the training set.
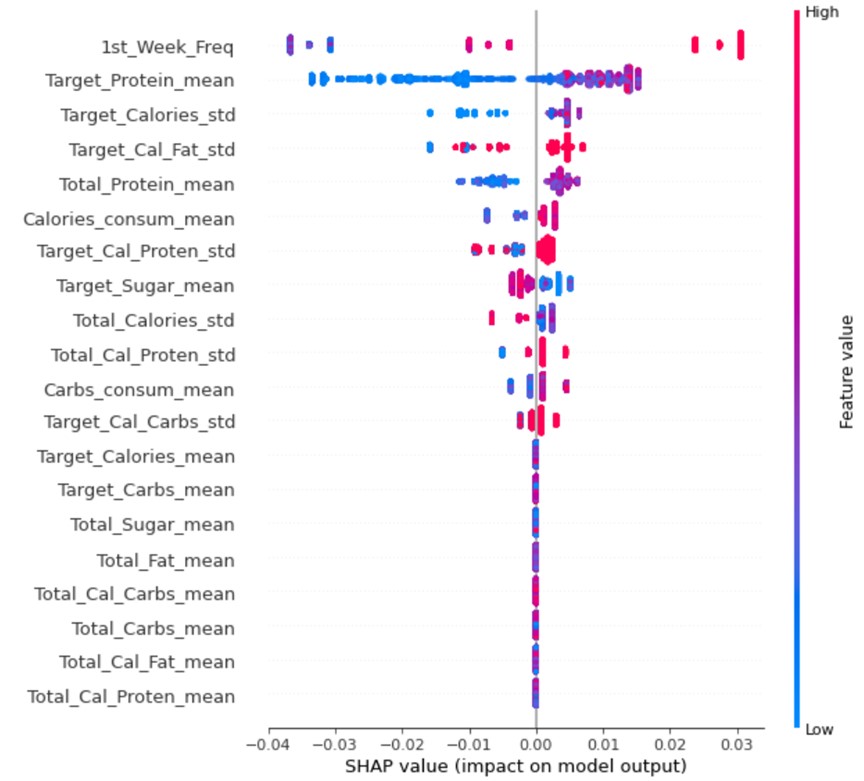
From the feature importance plot, we could observe that:
- 1st_Week_Freq: The more days a user keeps tracking food log within the first 7 days, the higher chance he or she will keeps doing it for two months.
- Target_Protein_mean: Both tree plot and feature importance plot indicate that there might be a cut-off threshold for Protein intake target. I will further explore it with partial dependence plot.
- Target_Sugar_mean: Put sugar under monitoring will help the client to keep tracking of food log. Also, there might be a cut-off threshold.
- Calories_consum_mean: This refers to the average of the ratio between daily calories actual intake and daily calories target. It seems that there is a certain threshold that if the ratio is lower, the chance to keep tracking food log becomes lower.
Further analysis will be needed to explain the potential cut-off thresholds identified for Calories consumption, target Protein, and target Sugar.
SHAP - Partial Importance Plot
We will start with the average target Protein. The figure below shows the partial importance plot.
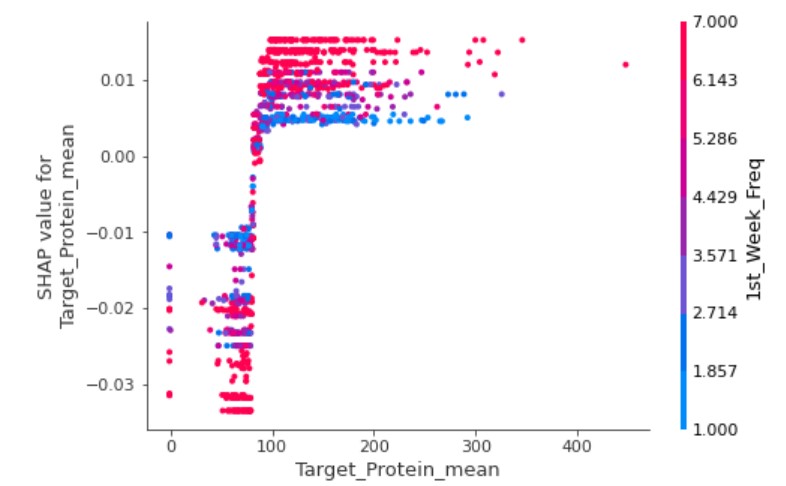
As expected, there is a clear cut-off threshold, probably around 90 grams. The SHAP value would be positive if the target protein is higher than 90 while all other features remain the same. In other words, a higher than 90 average Protein target has positive impact on sticking to the food diary.
90 grams of protein intake is quite high for general population. For example, a 70-kilogram person would consume about 56 grams to fulfill the daily needs. But, for someone in a weight loss program or muscle building program, 90 grams of protein is in the normal range. According to NASM, for the same 70 kg person, his or her protein intake target for weight loss should be between 84 grams and 182 grams.
This is a good indication, but we cannot use it to set target for clients. In a well-structured diet plan, the target of daily protein consumption depends on the situation of each client, including age, weight, fitness routine and so on. For example, a protein target that is good for a 25-years-old active male might not be good for clients in their 60s. Rather, to turn the insight into action, the key message to take away is to prioritize the protein target when work with client for a diet plan.
Then we will look at the average target Sugar.
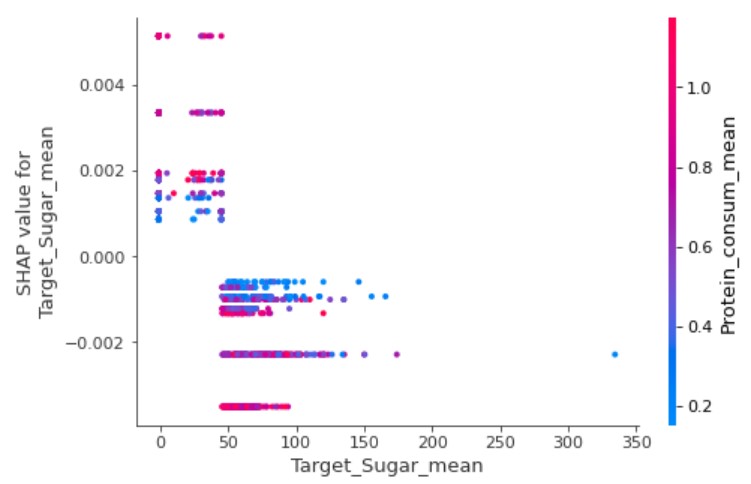
As expected, sugar target also has a clear cut-off threshold. Similar like target of protein, this indicates the importance to have a low target of sugar rather than provides a single threshold that works in all scenarios. The key action we could draw from the insight is to monitor the sugar consumption and to keep the target low.
Lastly let’s look at the average ratio between Calories consumed and Calories target.
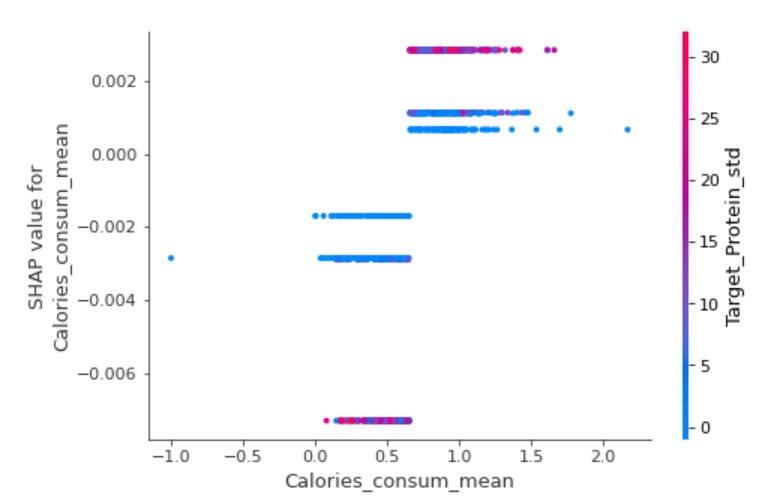
When people start weight management program, they might tend to consume less calories than the target so that it will create a feeling of great progress is being made. However, the insight suggests that this not a sustainable behavior. Instead, try to stay close to the target, at least 75%, could help the client to keep tracking food log for a long time.
There might be different hypothesis explaining why the ratio between Calories intake and Calories target could impact the willingness to stick to a food diary:
- People tend to underestimate their calories intake and overestimate their calories consumption. In this case, from a client’s point of view, he or she might be seeing great progress in term of reaching calories target but disappointing result from the weight management program. Without seeing the result, one will not stick to the food log for a long time.
- Assuming the calories calculation and recording are correct, then a low ratio between actual calories intake and calories target indicates that the client is not taking enough food. If a client is in a weight management program, this kind of behavior is not only unsustainable but also unhealthy and should be strongly discouraged.
The major take-away for personal trainer is to spend more time educate client the importance of reach the Calories target.
V. Actions Suggested
From the analysis of features, based on clients’ one week of food log, there are some actions we could take to help them stick to the food diary:
- Review the diet plan, to make sure they have the key elements under monitoring
- Make sure that protein target is set up properly
- Put sugar under monitoring and keep the target low
- Review the calories target and consumption, make sure they are properly estimated. Educate clients the importance of acquire enough calories instead of an aggressive diet plan
VI. Next Steps and Lessons Learned
Now we have a model to identify clients who might not keep food diary for a long time, and we know which the factors are driving the different behaviors. We also explore actions a personal trainer could take at an early stage.
As next step, there are more analysis we could perform:
- Conduct focus group or interview with clients and trainers, to validate the findings
- We only work on the daily summary here. The dataset includes the dishes as well. We could further explore how to add them into the analysis.
- We only use the behavior of client. Adding the demographic information of each client might help us in improving the model’s performance.
- We now treat all client as a single group. There might be segmentations within the clients
The key lessons learnt are:
- AI and machine learning techniques could provide insight, but domain knowledge is needed to response to the insight and to define the actions accordingly.
- Train the model is not the end of the work. Deep diving into the features and turn the data into actionable insight could be even more important.