分类问题评估指标
100-Same Tree | Links:
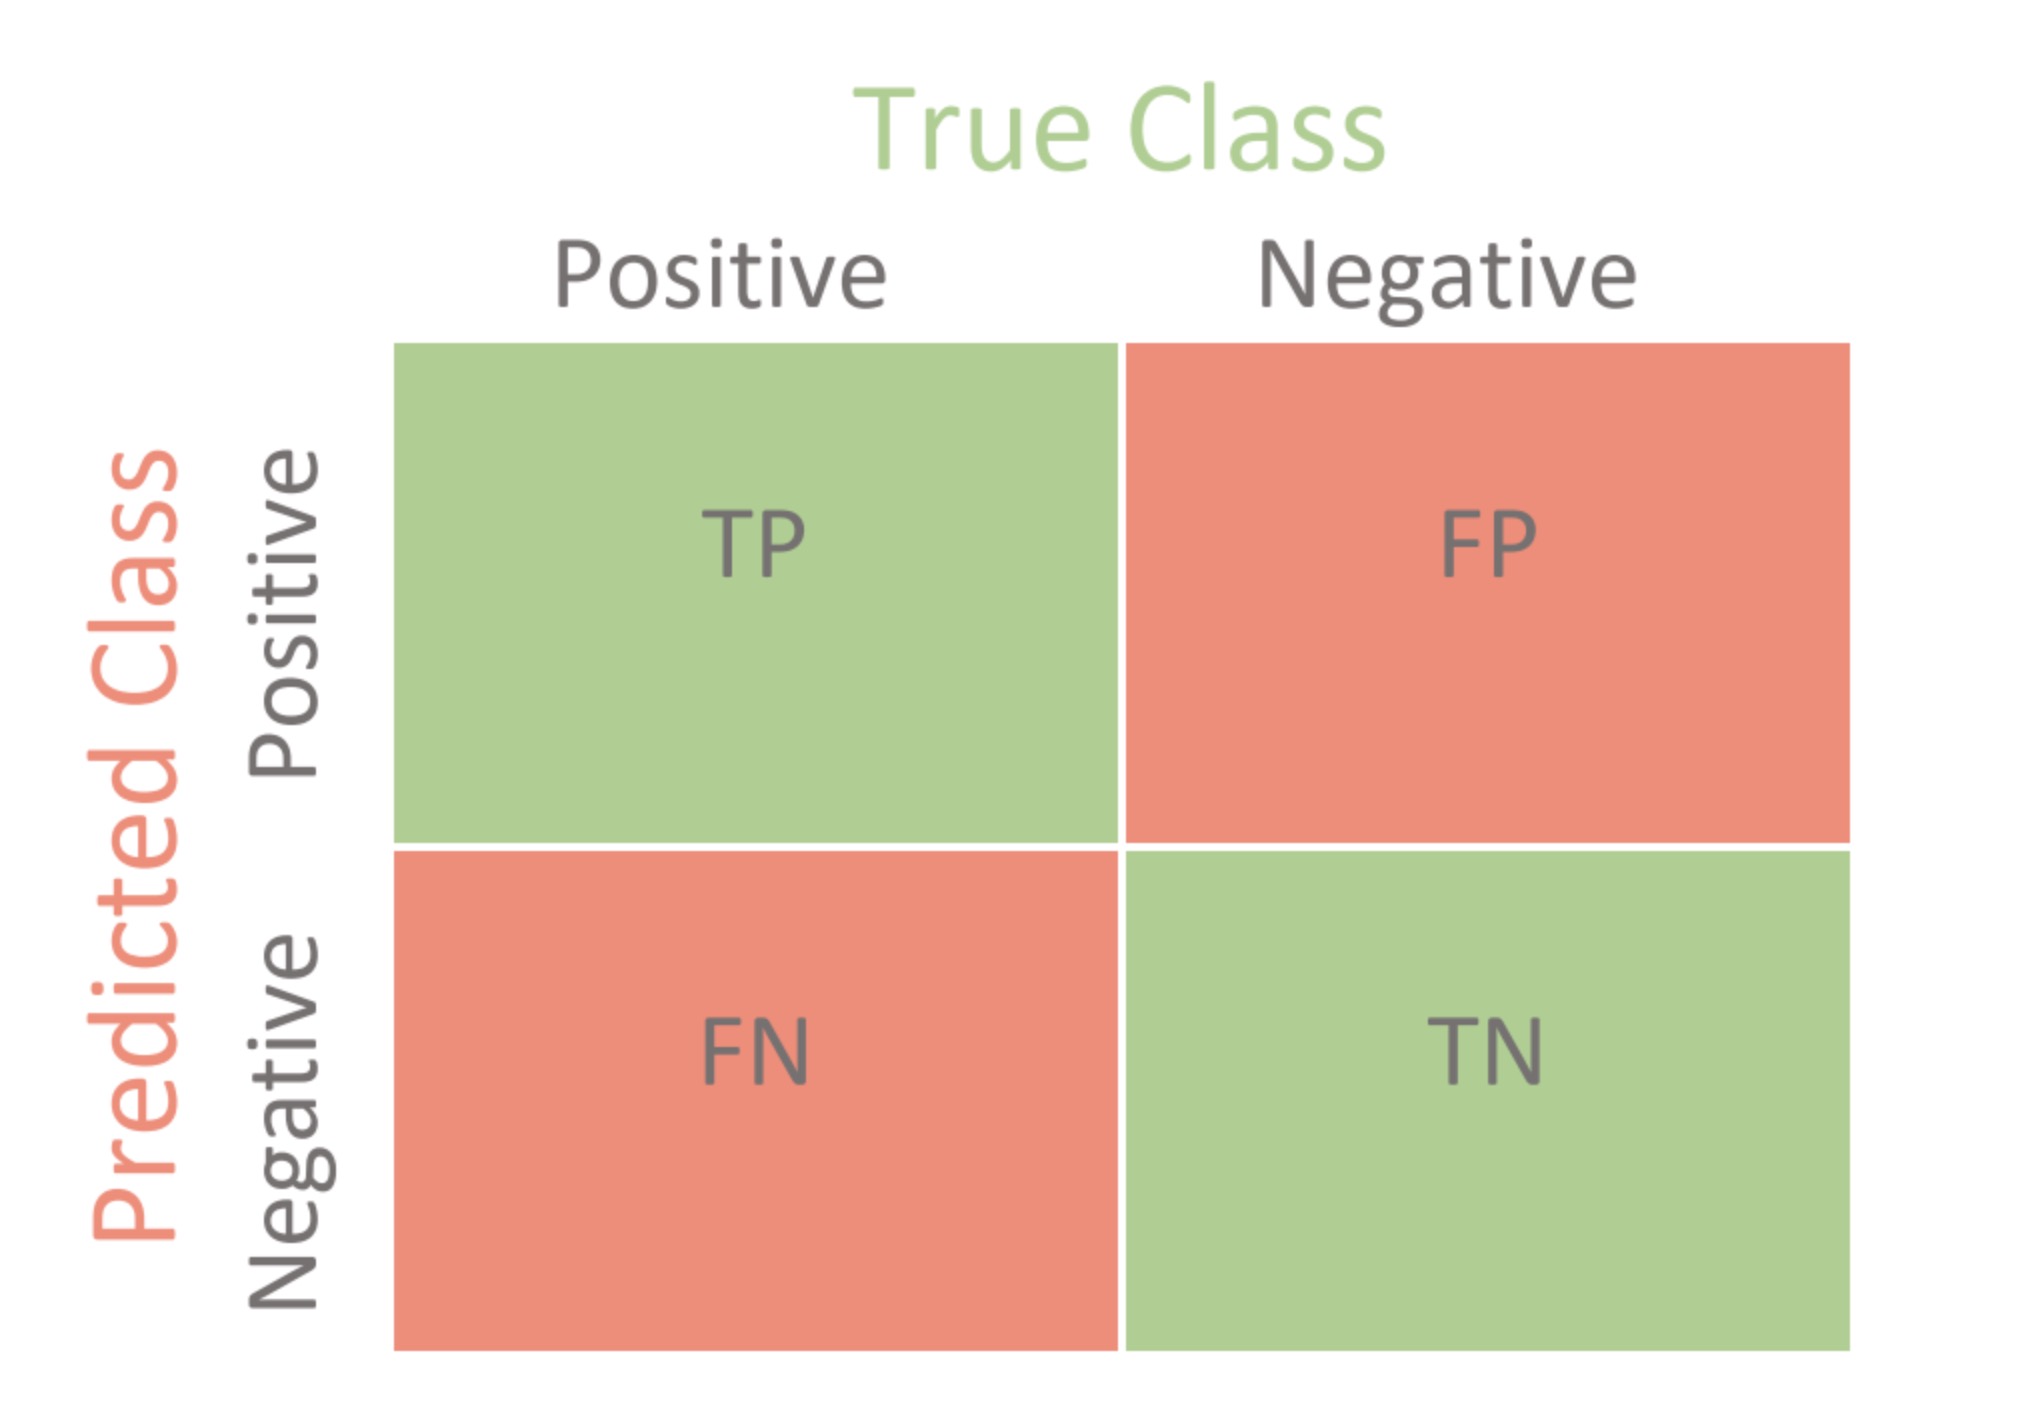
Confusion Matrix混淆矩阵

Accuracy + Error rate = 1
- Accuracy \(=\frac{T P+T N}{T P+F P+F N+T N}\)
- Error rate = 1 - Accuracy
Precision & Recall
- 查准率(准确率)precision:所有预估正例(所有positive)中有多少是真正的正例->找准了没有
- Precision \(=\frac{T P}{T P+F P}\)
- 查全率(召回率)Recall = Sensitivity=True positive rate:所有真实正例中有多少通过预测找回来了 -> 找全了没有
- Recall \(=\frac{T P}{T P+F N}\)
Sensitivity & Specificity
- Sensitivity=True positive rate = Recall: 所有真实正例中有多少通过预测找回来了
- Specificity: 所有反例中有多少通过预测找到
- Specificity = \(\frac{T N}{T N+F P}=\frac{T N}{N}\)
- False positive rate = 1 - specificity
F1 score & Fβ score
- Fβ值/Fβ score:查准率和查全率哪个更重要, 对precision & recall加权平均 \(F \beta=\frac{\left(1+\beta^{2}\right) \times \text { Precisoin } \times \text { Recall }}{\left(\beta^{2} \times \text { Precision }\right)+\text { Recall }}\)
- β = 1 -> F1 score: precision和 recall的调和平均 \(F 1=\frac{2 \times \text { Precisoin } \times \text { Recall }}{\text { Precision }+\text { Recall }}\)
ROC & AUC
- ROC curve:在不同threshold[1 ->0]下,true positive rate(sensitivity) vs. false positive rate(1- specificity) 的曲线
- 越接近左上角越好
- 45度相当于random guess
- AUC:area under the ROC curve, 越接近1越好
- AUC的物理意义:正样本的预测概率大于负样本的预测概率的概率
- 算法1:计算ROC曲线下的面积,拆分成若干个梯形的面积相加
- 算法2:预测出来的正负样本组成Pair, 查看正样本概率> 负样本概率的数量/ pair总数量
- 算法3:比正样本小的负样本的数量/ 正负样本的Pair数
PR curve & AUCPR
- PR curve: Precision vs. recall变化的曲线
- 越接近右上角越好,重点看Precision = recall 45度角的表现
- AUCPR:area under the PR curve, 越接近1越好