通过机器学习挖掘商业洞见:四种方法
100-Same Tree | Links:
通过机器学习挖掘商业洞见的一般策略
- 围绕你所关心的target和相关variables收集数据
- 建立一个机器学习模型预测target
- 模型解释:讨论每个variable是如何影响结果的
- 产出商业建议
四种常用方法
- 逻辑/线性回归模型 + 研究coefficients
- 决策树模型 + 研究树分裂结构
- 任意模型 + Partial Dependence Plot
- RuleFit + 研究挖掘出来的rule feature
通过Machine Learning挖掘洞见的下一步
- 这种insight的实质
- 告诉你对于一个商业问题,什么变量是重要的
- 告诉你变量的变化会如何影响结果
- 但这种insight不宜直接应用于生产,因为没有考虑改变的成本,也缺乏足够的确定性
- 得到insight之后-> 尝试性的做出改变 -> 进行AB test
1. Logistic Regression + Coefficients
1.1 Code
# Convert categorical features and check reference level
# make dummy variables from categorical ones
data = pd.get_dummies(df, drop_first=True)

# check the reference level
data_categorical = df.select_dtypes(['object']).astype('category')
print(data_categorical.apply(lambda x: x.cat.categories[0]))

# build logistic regression
import statsmodels.api as sm

features = data.drop('clicked', axis=1)
target = data['clicked']

# add intercept
data['intercept'] = 1
logit = sm.Logit(target, features)
output = logit.fit()

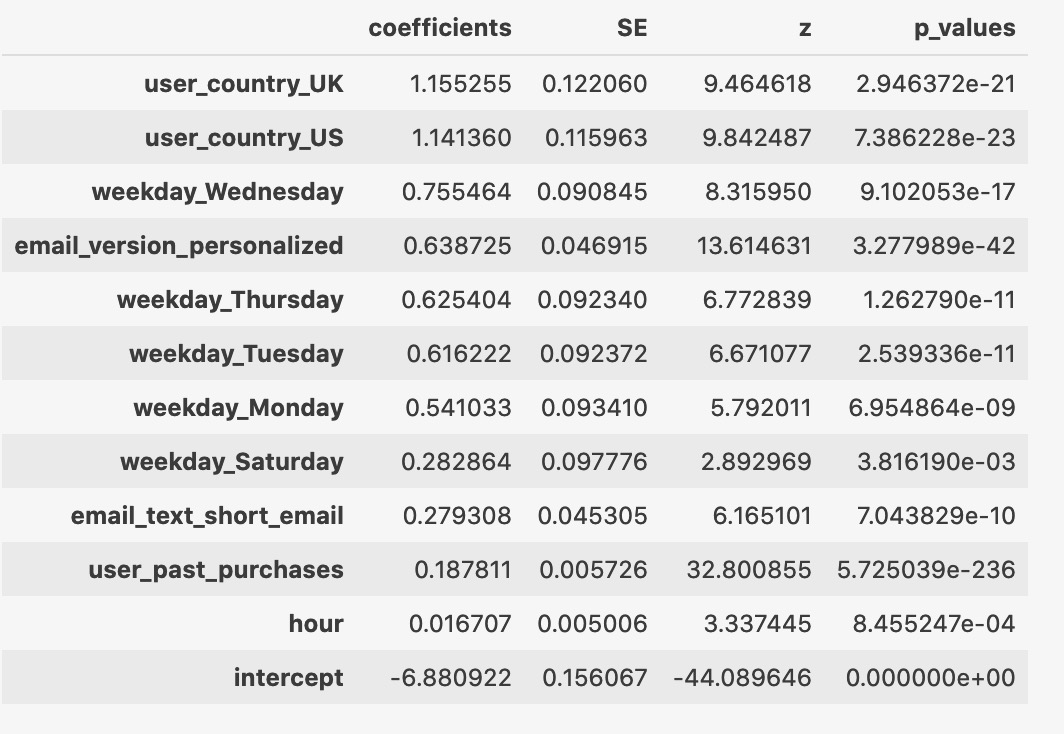
# interpret the model: 重点看coefficients + p_values
output_table = pd.DataFrame({'coefficients': output.params,
                             'SE': output.bse,
                             'z': output.tvalues,
                             'p_values': output.pvalues})
output_table

# important features: only keep significant variables and order results by coefficient value
output_table.loc[output_table['p_values'] < 0.05].sort_values('coefficients', ascending=False)
1.2 理解类别变量的转换与coefficient的解读
- One-hot encoding: n个level转换成n-1个dummy variable
- 去掉的那个level是reference level / baseline
- Coefficient的解读是相较于reference level的相对值
- Positive coefficient: 比reference level作用大(作用具体指推动target->1)
- Negative coefficient: 比reference level作用小
- 基于商业需求,可手动设定reference level
- 需要手动的情形:最常见的level/ 需要拿来做比较的level / 研究新市场增长,可拿当前最好的市场做reference level
1.3 优劣
优
- 逻辑回归模型广为熟知,方便团队之间沟通合作
- 简单,快速,稳定
- 因为需要进行logit函数转换,结果不易于可视化
劣
- 关注的是feature与target之间的线性关系:将现实粗暴简单化,不利于找segment
- 不同量级(Scale)的feature会影响结果,但经过normalization之后又变得不易解读
2. Decision Tree + Tree Plot
2.1 Code
import graphviz
from sklearn.tree import DecisionTreeClassifier
from sklearn.tree import export_graphviz
import pydotplus
from IPython.display import Image
from IPython.display import display

tree = DecisionTreeClassifier(class_weight="balanced",
                              max_depth=4,
                              min_impurity_decrease=0.001)
tree.fit(features, target)

# tree plot
dot_data = export_graphviz(tree,
                           out_file=None,
                           feature_names=features.columns,
                           proportion=True,
                           rotate=True,
                           filled=True)

graph = pydotplus.graph_from_dot_data(dot_data)
display(Image(graph.create_png()))
2.2 解读Tree Plot
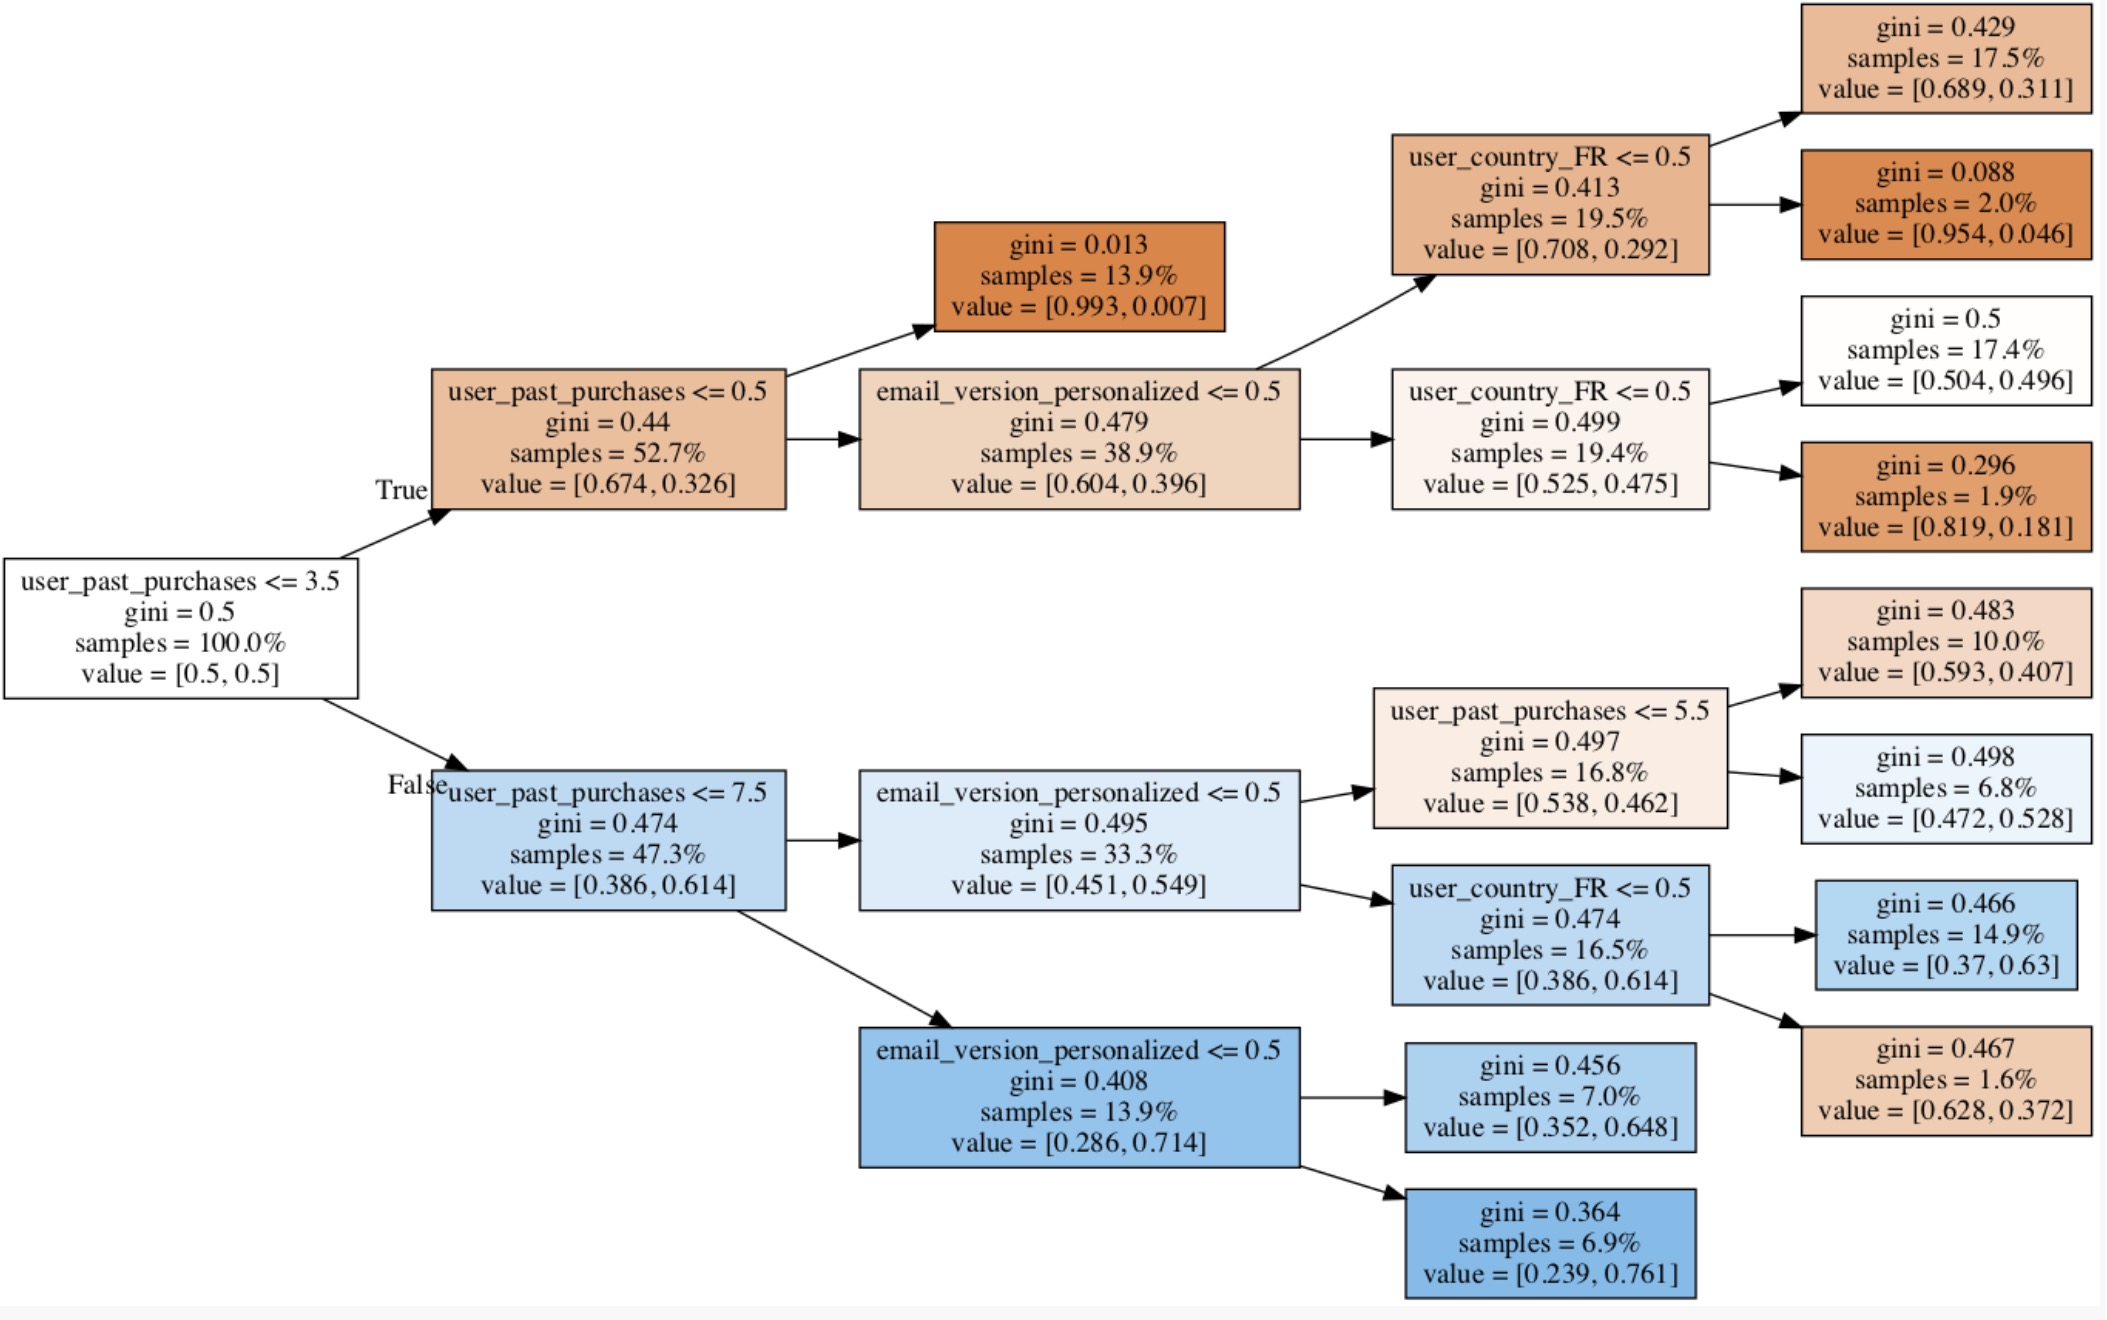
- 每个block是一个树节点,右边终端是叶节点
- block中的四个值
- Split
- Gini index of the node:节点的纯洁度。越小越好,0.5相当于random guess
- Samples: 当前节点的sample在总体中的比例。越大越好,说明该节点捕捉了多数人
- Value:当前节点中class 0和class 1的比例,二者的和为1,也反映了节点的纯洁度。Class 1大于0.5时标记为1,否则为0
- 首先看First split: 最重要的segment
- 在first split之后看几个重要的split
- 也许split只集中在几个variable:因为我们只是基于宏观信息建了一个small tree, 过于细微的split难以在small tree画出来,信息量也不大
2.3 优劣
优
- 方便寻找feature/ target之间的非线性关系
- 方便看variable之间是如何互动的
- 自动进行segmentation,易于解释
- 通常表述为:This segment represents X% of the population and they are Y times more likely to click. If we send personalized emails to these people, we can expect an increase in click rate of Z%.
- 方便寻找threshold, 用于建立metric
- 大多数metric将对象基于一定的threshold分成good / bad, 目标是增加good的比例,用树模型极其有用。例如
- Early FB growth metric: users with at least X friends in Y days
- Engagement: users performing at least X actions per day
- Response rate: proportion of questions with at least 1 answer within X hour
- Conversion rate: proportion of users who convert within X time since their first visit
- 大多数metric将对象基于一定的threshold分成good / bad, 目标是增加good的比例,用树模型极其有用。例如
- 了解不同需求的priority
劣
- 除了first split, 其它split都是基于first split的条件概率 -> 不同反映overall impact
- Small tree只显示first few splits:基于macro-information, 不适用small improvement
- 应对方案:可以去掉几个重要特征,重新建模
- Large tree不易理解,信息量不大
3. Partial Dependence Plot(PDP)模型
3.1 PDP原理
- 训练任意模型
- 将训练集中某个variable X的所有unique value创建成vector [x1,x2, …, xn]
- 遍历所有unique value
- 将数据集中所有variable X的值替换成x1
- 将新数据集放入模型,进行预测,取平均值
- 在Plot上绘制一点,x轴为x1, y轴为平均值
- 下一取值
- 将数据集中所有variable X的值替换成x1
3.2 理解Python模型自带的feature importance
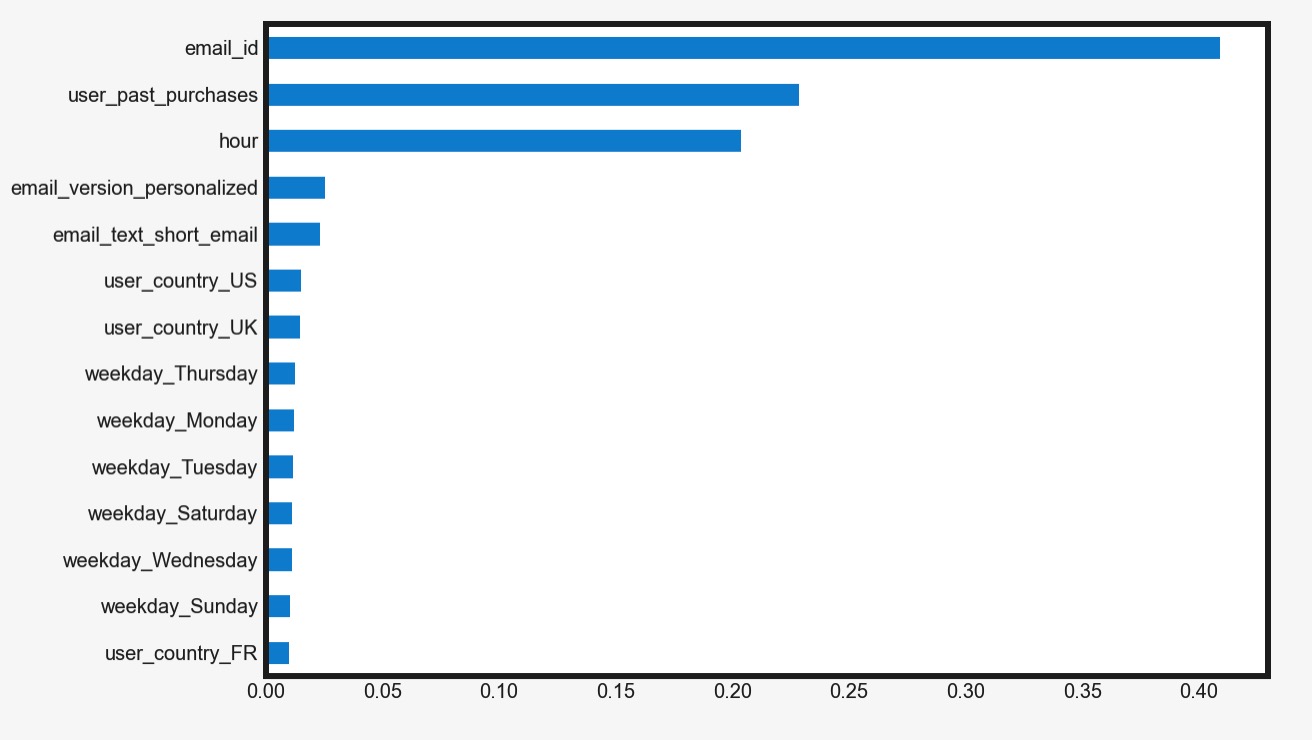
- 自带功能产生Feature Importance图未必准确,且信息量有限,不要过于依赖
- model直接产生的feature importance是针对feature one-hot encoding之后的,而不是针对原features
- level多的类别变量会被惩罚,重要性被分散
# python build-in feature importance
feat_importances = pd.Series(rf.feature_importances_, index=features.columns)
feat_importances.sort_values(ascending=True).plot(kind='barh')
plt.show()
3.3 PDP Code
# partial dependence plot on one feature
from pdpbox import pdp, info_plots

# country
pdp_iso = pdp.pdp_isolate(model=rf,
                          dataset=x_train,
                          model_features=list(x_train),
                          feature=['country_Germany', 'country_UK', 'country_US'],  ### levels in this feature
                          num_grid_points=50)
pdp_dataset = pd.Series(pdp_iso.pdp, index=pdp_iso.display_columns)
pdp_dataset.sort_values(ascending=False).plot(kind='bar', title='Country')  ### one categorical feature
plt.show()


# PDP for all features
feat_original = df.columns.drop('clicked')

for i in range(len(feat_original)):
    plot_variable = [e for e in list(features) if e.startswith(feat_original[i])]

    if len(plot_variable) == 1:  # numeric variables or dummy with just 1 level
        pdp_iso = pdp.pdp_isolate(model=rf,
                                  dataset=features,
                                  model_features=list(features),
                                  feature=plot_variable[0],
                                  num_grid_points=50)
        pdp_dataset = pd.Series(pdp_iso.pdp, index=pdp_iso.feature_grids)
        pdp_dataset.plot(title=feat_original[i])
        plt.show()
    else:  # categorical variables with several levels
        pdp_iso = pdp.pdp_isolate(model=rf,
                                  dataset=features,
                                  model_features=list(features),
                                  feature=plot_variable,
                                  num_grid_points=50)
        pdp_dataset = pd.Series(pdp_iso.pdp, index=pdp_iso.display_columns)
        pdp_dataset.sort_values(ascending=False).plot(kind='bar', title=feat_original[i])
        plt.show()
3.4 PDP解读
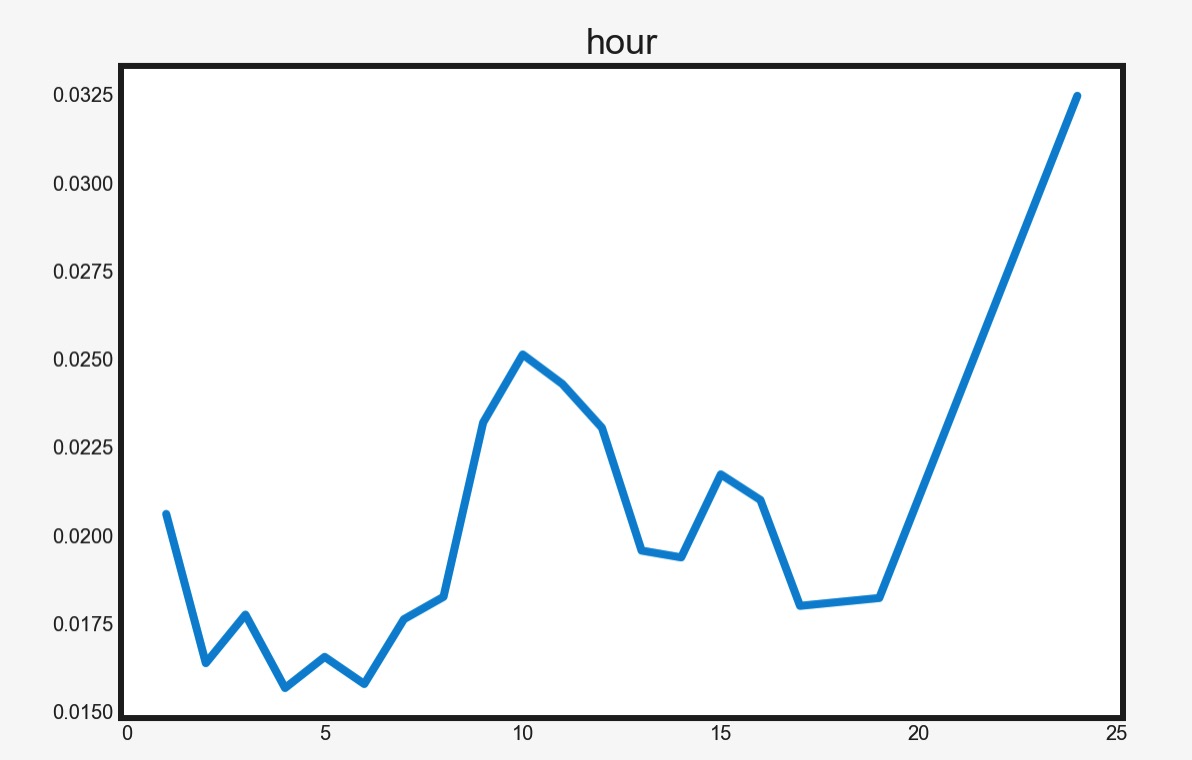
- y轴值越大,feature越重要
- y值的涵义:对指定变量做改变,会对结果带来多大的变化
3.5 优劣
优
- 最可靠的挖掘洞见的方式
- 可与任何模型结合,与black-box的复杂模型(random forest/ boosting trees)配合更加
- 方便可视化
- 深度理解各个变量如何影响结果
劣
- 注意连续变量出现的huge peak/ drop -> 可能是noise导致,说明该segment中样本太少
- PDP原理不普及,对外传达,需要进一步解释涵义
4. RuleFit
4.1 核心思想
- 将regression模型与decision tree相结合
4.2 原理
- 建立树分类模型(通常是random forest, 考虑到计算量树的层次较浅)
- 利用树的分裂机构挖掘rule(rule即从跟到叶的分裂条件)
- 根据rule创建dummy varibles,与原数据合并形成新的数据集
- 在新数据集上建立logistic regression model
4.3 Code
from numpy.core.umath_tests import inner1d
from sklearn.ensemble import RandomForestClassifier
from sklearn.linear_model import LogisticRegression
from rulefit import RuleFit

# np.random.seed(4684)

data = pd.get_dummies(data, drop_first=True)
features = data.drop('clicked', axis=1)
target = data['clicked']

# Extract rules from Random Forest
rf = RandomForestClassifier(max_depth=2,  # keep trees small to make Rulefit faster
                            n_estimators=10,
                            class_weight={0: 0.05, 1: 0.95})

# set RuleFit parameters
rufi = RuleFit(rfmode="classify",
               tree_generator=rf,
               exp_rand_tree_size=False,
               lin_standardise=False)

# fit RuleFit
rufi.fit(features.values, target.values, feature_names=features.columns)
print("We have extracted", rufi.transform(features.values).shape[1], "rules")

# check a few rules we have extracted
output = rufi.get_rules()
print(output[output['type'] == "rule"]['rule'].head().values)

# new_features = new dummy variables + original variables
new_features = np.concatenate((features, rufi.transform(features.values)), axis=1)
# Build the logistic regression with penalty.
# L1: This will set low coefficients to zero, so only the relevant ones will survive
log = LogisticRegression(penalty='l1',
                         solver='liblinear',
                         C=0.1)
log.fit(new_features, target)

# get the full output with variables, coefficients, and support
output.iloc[:, 2] = np.transpose(log.coef_)
output[output['coef'] != 0].sort_values('coef', ascending=False)
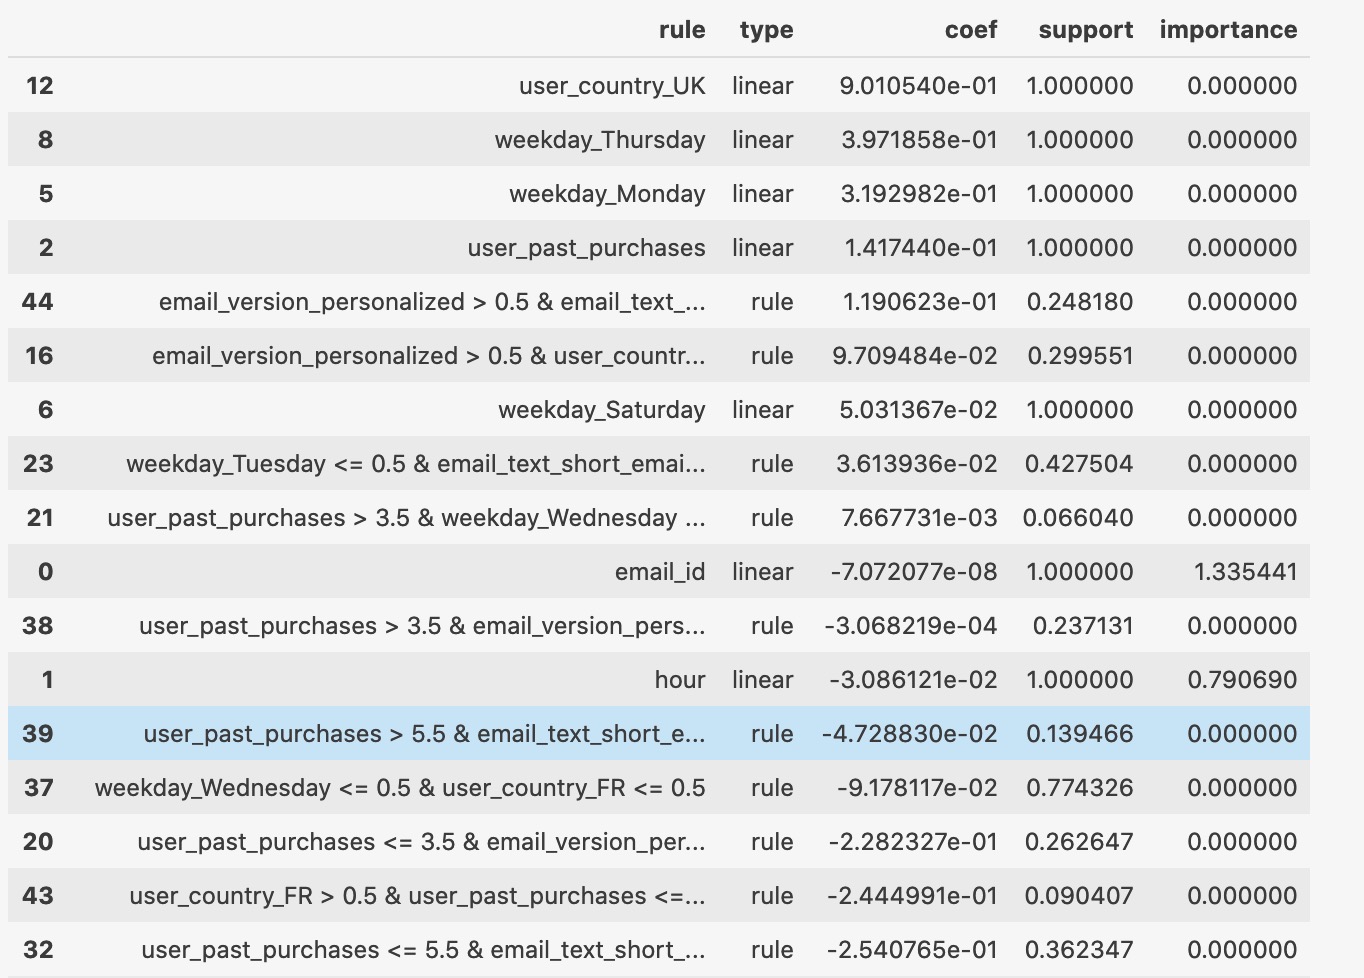
4.4 解读
- Rule: feature name
- Type: original variable, or rule extracted from the forest
- Coefficient: the coefficient of that variable in the final regression.
- Support: linear feature为1, rules表示proportion of sample for which that rule is true
- For rules, the best supports are close to 0.5 -> rule is good in separating events.
- For rules, support close to 0/1 -> useless
- 目标:重点看coefficient系数高且support接近0.5的rule
4.5 优劣
优
- 将线性和非线性关系都考虑进来
- 使用灵活: 可以决定如何建random forest, 如何extract rule, 如何建logistic regression
劣
- 计算量大
- 不够流行
- 如果某个feature在rule中使用多次,很难孤立评估它的影响 -> 可以考虑将PDP与RuleFit合用